
According to the Seventh World Symposium on Pulmonary Hypertension in 2024, pulmonary hypertension (PH) is defined as a mean pulmonary artery pressure (mPAP) of >20 mmHg. Pre-capillary PH is defined by mPAP of >20 mmHg and elevation of pulmonary vascular resistance (PVR) above the upper limit of normal which is 2 Wood Units (WU) and pulmonary arterial wedge pressure <15 mmHg.1 Pre-capillary PH is characteristic of haemodynamic conditions and diseases with elevated pulmonary pressures and no significant left heart disease.1 The causes of pulmonary arterial hypertension (PAH) include idiopathic, familial, drug and toxin-induced, associated with (connective tissue disorder, HIV, portal hypertension, congenital heart disease, schistosomiasis), and PAH with overt features of venous/capillary involvement.1 Regardless of the cause, the pathology is similar, with remodelling and proliferation of endothelial and smooth muscle cells, increased vasoconstriction and thrombus formation. This leads to restricted flow within the pulmonary arterial circulation causing increased vascular resistance, right-sided heart failure and death.2 Currently available treatments include phosphodiesterase-5 inhibitors, endothelin-receptor antagonists, soluble guanylate cyclase stimulators and compounds targeting the prostacyclin pathway (PPA).2 Recent studies have identified another pathway that leads to PAH. Altered signalling in the transforming growth factor β superfamily, particularly involving bone morphogenetic protein receptor type 2, activin receptor type 2A and ligands such as activin A, activin B, growth differentiation factor 8 (GDF8) and GDF11 causes cell proliferation and inhibits apoptosis, leading to pulmonary vascular remodelling. Inhibition of these ligands inhibits cell proliferation, promotes apoptosis and decreases inflammation in the vessel walls, leading to reverse remodelling and potential restoration of vessel patency.3
In the USA, population studies on idiopathic pulmonary arterial hypertension (IPAH) are restricted, with most data available from PAH registries.4–12 US–based Registry to Evaluate Early and Long-Term PAH Management (REVEAL) shows the incidence of IPAH as 2.3 cases per million and a prevalence of 12.4 cases per million.10 One-year mortality rate was 9–14% based on data from 2006 to 2009.13 Since that time, major advances in treatment have been made, but little is known about how these developments have impacted the characteristics of IPAH-related hospitalizations. We use the largest in-patient database in the USA, the Nationwide Inpatient Sample (NIS), to analyse IPAH hospitalizations over the span of 10 years comparing admissions from 2007 with 2017. This is the first study to compare these two cohorts in the USA.
Methods
The Healthcare Utilization Project (HCUP) is a collection of databases funded by the Agency for Healthcare Research and Quality. In this study, we used the HCUP-linked database, NIS, for the years 2007 and 2017. NIS is the largest and most comprehensive all-payer database of in-patient hospitalizations in the USA.14 It contains administrative data from approximately 1,000 hospitals with more than 8 million hospitalizations a year. It is a 20% stratified sample of all in-patient hospitalizations from 46 states, representing more than 95% of the US population. The patient data are de-identified and include information on socio-demographics, admission status, primary and secondary discharge diagnoses, comorbidities, treatments, in-hospital mortality and healthcare resource use. The diagnoses are identified using the International Classification of Diseases Ninth Revision, Clinical Modification (ICD-9-CM) codes for 2007 data, and ICD-10-CM codes are used for 2017.6 Institutional Review Board approval and informed consent were not required for this study, as it involved analysis of de-identified publicly available data.
We included patients 18 years of age or older from 1 January 2007 to 31 December 2007 and from 1 January 2017 to 31 December 2017. For the 2007 data, ICD-9-CM codes were used, and for the 2017 data, ICD-10-CM codes were used (Table S1).
The following data were obtained for patients who were admitted with the diagnosis of IPAH: total hospitalizations, demographics, elective versus non-elective admissions, primary payer, median household income, location/teaching status of the hospital (rural, urban non-teaching and urban teaching), region of the hospital (north-east, mid-west, south and west), bed size (small, medium and large) and patient disposition (home, transfer to short-term hospital, skilled nursing facility or intermediate care facility and home healthcare), comorbidities, all-cause mortality, median length of stay and median hospitalization charges and complications.
We used Pearson’s Chi-square test and Mann–Whitney U test to equate the categorical and continuous variables between the 2007 and 2017 cohorts. We have reported results as numbers or percentages and median with interquartile range, respectively. We have provided a comparative analysis of demographics, comorbidities and outcomes related to IPAH admissions between the years 2007 and 2017. In addition, we also compared the frequency of all-cause mortality of IPAH-related admissions and assessed sex- and race-based differences in this subgroup. Statistically significant independent predictors on univariate analysis were integrated into a multivariate regression analysis to assess the risk of complications and in-hospital mortality in 2017 as compared with 2007. The outcomes were indicated in terms of adjusted odds ratio (aOR) with 95% confidence interval (95% CI). Multi-variate analysis was performed adjusting for age, sex, race, type of admission (elective/non-elective), median household income quartile, primary insurance enrolment and pre-existing comorbidities. Independent predictors of all-cause mortality in IPAH were also evaluated with a multivariate analysis adjusted for aforementioned variables. A two-tailed p<0.05 was considered a threshold for statistical significance. SPSS v24 (IBM Corp, Armonk, NY, USA) and weighted data were used to complete statistical analyses using complex sample modules.
Results
When comparing 2007 with 2017, the total number of IPAH hospitalizations decreased significantly from 17,713 to 9,330 (p<0.001) which is 0.05% and 0.03% of total hospitalizations, respectively (Table 1). Table 2 shows the characteristics of IPAH hospitalizations in 2007 and 2017. Compared with 2007, the median age of admission had significantly decreased in 2017 (p<0.001) from age 72 years to 66 years. The number of admissions in females continued to stay high in both 2007 (65.2%) and 2017 (68.4%) compared with males (p<0.001) for IPAH. In 2007 and 2017, Whites continued to have the highest number of admissions for IPAH compared with other races (67.4% versus 64.1%). Over this decade, the percentage of hospitalizations at large bed hospitals decreased (66.8–60.7%), but small (14.4–16%) and medium bed hospitals (18.9–23.3%) (p<0.001) increased. Regional variations showed decreased hospitalizations in the north-east (35.4–20.9%), but increased hospitalizations in south (31.7–34.1%), mid-west (16.8–23.7%) and west (16.1% to 21.3%) (p<0.001) over that time period (Table 2). Table 3 shows the clinical characteristics of IPAH hospitalizations in 2007 and 2017. In 2017, there was a higher percentage of hospitalizations with comorbid congestive heart failure, depression, drug abuse, liver disease, obesity and smoking. No change in length of stay was seen in 2007 as compared with 2017 (Table 4). Total charges significantly increased from 2007 ($26,016 [$14,043–$53,668]) to 2017 ($46,450 [$24,388–$92,961]) (p<0.001). When adjusted for inflation, charges for IPAH hospitalizations remained higher in 2017 and were calculated at $6,707 ($3,895–$12,557) for 2007 and $7,030 ($3,687–$13,601) for 2017 (p<0.001) (Table 4). However, when looking at the percentage of charges for IPAH as compared with total charges for all hospitalization, we see a significant decrease from 0.09% ($340,839,104/$359,759,284,438) to 0.06% ($266,170,409/$434,241,375,872) from 2007 to 2017 (Table 5).
Table 1: Total hospitalizations for IPAH
| Hospitalizations (p<0.001) |
| Calendar year | Total | |
| IPAH |
| 2007 | 2017 | |
|
| N | 17,713 | 9,330 | 27,043 |
|
| % Within year | 0.05% | 0.03% | 0.04% |
|
| Total N | 32,718,626 | 35,798,453 | 68,517,079 |
IPAH = idiopathic pulmonary arterial hypertension.
Table 2: Demographics and hospital characteristics of hospitalizations with IPAH in 2007 versus 2017
| Variables | 2007 (N=17,713) | 2017 (N=9,330) | p | |||
| N | % | N | % |
| ||
| Age in years at admission, median (IQR) | 72 (57–82) |
| 66 (52–77) |
| <0.001 | |
|
| 18–44 | 1,809 | 10.2% | 1,070 | 12.2% | <0.001 |
| 45–64 | 4,496 | 25.4% | 2,740 | 31.2% | ||
| ≥65 | 11,408 | 64.4% | 4,965 | 56.6% | ||
| Sex | Male | 6,166 | 34.8% | 2,950 | 31.6% | <0.001 |
| Female | 11,542 | 65.2% | 6,380 | 68.4% | ||
| Race | White | 9,349 | 67.4% | 5,755 | 64.1% | <0.001 |
| African American | 2,413 | 17.4% | 1,755 | 19.5% | ||
| Hispanic | 972 | 7.0% | 865 | 9.6% | ||
| Asian or Pacific Islander | 394 | 2.8% | 255 | 2.8% | ||
| Native American | 231 | 1.7% | 45 | 0.5% | ||
| Others | 517 | 3.7% | 305 | 3.4% | ||
| Elective versus non-elective admission | Non-elective | 15,060 | 85.1% | 7,945 | 85.3% | 0.725 |
| Elective | 2,630 | 14.9% | 1,370 | 14.7% | ||
| Primary expected payer | Medicare | 11,931 | 67.4% | 5,795 | 62.3% | <0.001 |
| Medicaid | 1,692 | 9.6% | 1,310 | 14.1% | ||
| Private including health maintenance organization | 3,309 | 18.7% | 1,875 | 20.2% | ||
| Self-pay | 397 | 2.2% | 165 | 1.8% | ||
| No charges | 56 | 0.3% | 20 | 0.2% | ||
| Others | 308 | 1.7% | 135 | 1.5% | ||
| Median household income national quartile for patient ZIP Code | 0–25th | 4,604 | 26.8% | 2,655 | 28.9% | <0.001 |
| 26–50th | 3,322 | 19.3% | 2,410 | 26.2% | ||
| 51–75th | 4,270 | 24.8% | 2,250 | 24.5% | ||
| 76–100th | 4,988 | 29.0% | 1,875 | 20.4% | ||
| Bed size of hospital | Small | 2,540 | 14.4% | 1,490 | 16.0% | <0.001 |
| Medium | 3,338 | 18.9% | 2,175 | 23.3% | ||
| Large | 11,820 | 66.8% | 5,665 | 60.7% | ||
| Location/teaching status of hospital | Rural | 999 | 5.6% | 760 | 8.1% | <0.001 |
| Urban non-teaching | 5,632 | 31.8% | 1,405 | 15.1% | ||
| Urban teaching | 11,068 | 62.5% | 7,165 | 76.8% | ||
| Region of hospital | North-east | 6,269 | 35.4% | 1,950 | 20.9% | <0.001 |
|
|
|
|
|
| ||
| Mid-west | 2,979 | 16.8% | 2,210 | 23.7% | ||
| South | 5,610 | 31.7% | 3,180 | 34.1% | ||
| West | 2,854 | 16.1% | 1,990 | 21.3% | ||
p<0.05 indicates statistical significance.
IPAH = idiopathic pulmonary arterial hypertension;IQR = interquartile range;ZIP = Zone Improvement Plan.
Table 3: Clinical characteristics in hospitalizations with IPAH in 2007 versus 2017
|
| 2007 (N=17,713) | 2017 (N=9,330) | p | ||
|
| N | % | N | % |
|
| Alcohol abuse | 352 | 2.0% | 195 | 2.1% | 0.569 |
| Chronic pulmonary disease | 5,686 | 32.1% | 2,900 | 31.1% | 0.087 |
| Coagulopathy | 1,244 | 7.0% | 1,140 | 12.2% | <0.001 |
| Congestive heart failure | 4,976 | 28.1% | 2,840 | 30.4% | <0.001 |
| Deficiency anaemias | 3,470 | 19.6% | 1,855 | 19.9% | 0.567 |
| Depression | 1,465 | 8.3% | 930 | 10.0% | <0.001 |
| Diabetes with chronic complications | 1,089 | 6.2% | 1,775 | 19.0% | <0.001 |
| Diabetes, uncomplicated | 4,122 | 23.3% | 810 | 8.7% | <0.001 |
| Drug abuse | 319 | 1.8% | 300 | 3.2% | <0.001 |
| Fluid and electrolyte disorders | 4,930 | 27.8% | 2,980 | 31.9% | <0.001 |
| Hyperlipidaemia | 3,991 | 22.5% | 3,415 | 36.6% | <0.001 |
| Hypertension | 7,545 | 42.6% | 3,150 | 33.8% | <0.001 |
| Hypothyroidism | 2,273 | 12.8% | 1,310 | 14.0% | 0.005 |
| Liver disease | 755 | 4.3% | 570 | 6.1% | <0.001 |
| Lymphoma | 227 | 1.3% | 115 | 1.2% | 0.732 |
| Metastatic cancer | 316 | 1.8% | 95 | 1.0% | <0.001 |
| Obesity | 1,846 | 10.4% | 1,585 | 17.0% | <0.001 |
| Other neurological disorders | 1,016 | 5.7% | 630 | 6.8% | 0.001 |
| Peripheral vascular disorders | 1,328 | 7.5% | 450 | 4.8% | <0.001 |
| Psychoses | 321 | 1.8% | 235 | 2.5% | <0.001 |
| Renal failure | 3,930 | 22.2% | 2,215 | 23.7% | 0.004 |
| Rheumatoid arthritis/collagen vascular diseases | 674 | 3.8% | 745 | 8.0% | <0.001 |
| Smoking | 2,393 | 13.5% | 3,230 | 34.6% | <0.001 |
| Solid tumour without metastasis | 345 | 1.9% | 115 | 1.2% | <0.001 |
| Valvular heart disease | 3,078 | 17.4% | 820 | 8.8% | <0.001 |
p<0.05 indicates statistical significance.
IPAH = idiopathic pulmonary arterial hypertension.
Table 4: Outcomes of hospitalizations with IPAH in 2007 versus 2017
| Outcomes | 2007 (N=17,713) | 2017 (N=9,330) | p | ||
|
| N | % | N | % |
|
| All-cause in-hospital mortality | 1,130 | 6.4% | 450 | 4.8% | <0.001 |
| Disposition of patient |
|
|
|
|
|
| Routine | 8,830 | 49.9% | 4,550 | 48.8% | <0.001 |
| Transfer to short-term hospital | 587 | 3.3% | 385 | 4.1% | |
| Other transfers including SNF ICF, etc. | 3,621 | 20.4% | 1,675 | 18.0% | |
| Home healthcare | 3,369 | 19.0% | 2,190 | 23.5% | |
| Complications |
|
|
|
|
|
| Cor-pulmonale | 213 | 1.2% | 445 | 4.8% | <0.001 |
| Pulmonary embolism | 409 | 2.3% | 285 | 3.1% | <0.001 |
| Pulmonary haemorrhage/haemoptysis | 176 | 1.0% | 120 | 1.3% | 0.028 |
| Atrial fibrillation/flutter | 6,267 | 35.4% | 3,275 | 35.1% | 0.648 |
| Ventricular tachycardia | 558 | 3.1% | 325 | 3.5% | 0.143 |
| Ventricular fibrillation/flutter | 61 | 0.3% | 30 | 0.3% | 0.758 |
| Supraventricular tachycardia | 164 | 0.9% | 300 | 3.2% | <0.001 |
| Cardiac arrest | 169 | 1.0% | 145 | 1.6% | <0.001 |
| Cardiogenic shock | 156 | 0.9% | 270 | 2.9% | <0.001 |
| Length of stay (days), median (QR) | 5 (3–9) | 5 (3–9) | <0.001 | ||
| Total charges (USD), median (IQR) | 26,016 (14,043–53,668) | 46,450 (24,388–92,961) | <0.001 | ||
| Total inflation adjusted cost (USD), median (IQR) | 6,707 (3,895–12,557) | 7,030 (3,687–13,601) | <0.001 | ||
p<0.05 indicates statistical significance
ICF = intermediate care facility;IPAH = idiopathic pulmonary arterial hypertension;IQR = interquartile range;QR = quartile range;SNF = skilled nursing facility;USD = United States Dollars.
Table 5: Adjusted cost for IPAH hospitalizations versus all hospitalizations
|
| 2007 | 2017 |
| IPAH hospitalizations cost | $340,839,104 | $266,170,409 |
| Total hospitalizations cost | $359,759,284,438 | $434,241,375,872 |
| Percentage of IPAH admission cost | 0.09% | 0.06% |
IPAH = idiopathic pulmonary arterial hypertension.
Total all-cause mortality for hospitalizations for IPAH decreased from 2007 (6.4%) to 2017 (4.8%) p<0.001 (Table 4). Figure 1 shows the percentage of death from all IPAH hospitalizations by sex and race for each year. Males had higher mortality than females in 2007 (7.1% versus 6.0%) and 2017 (5.6% versus 4.5%) p<0.05. White patients had higher mortality than Black patients in 2007 (6.6% versus 6.1%) and 2017 (5.1% versus 4.6%) p<0.05. Independent predictors of all-cause mortality in hospitalizations with IPAH are shown in Table 6. For each year, mortality was estimated for each of these parameters (age, gender, race, bed size and region) and compared. Patients in the age group 45–64 years (OR, 2.09 [95% CI: 1.55, 2.82] p<0.001) and over 65 years (OR, 4.09 [95% CI: 2.97, 5.63] p<0.0001) had higher mortality compared with those admitted between ages 18 and 44. Compared with females, males had higher mortality (OR, 1.18 [95% CI: 1.03, 1.35] p=0.015). Mortality was calculated for each race for each time point. From the total IPAH deaths in 2007, 69.7% were White (788/1130) and 16.7% were Black (189/1130). In 2017, 72% were White (324/450) and 19.5% were Black (88/450). Compared with White patients, Black patients (OR, 0.79 [95% CI: 0.66, 0.95] p=0.014) and Hispanics (OR, 0.65 [95% CI: 0.48, 0.86] p=0.003) had lower mortality. Compared with Medicare beneficiaries, patients who had Medicaid (OR, 1.66 [95% CI: 1.29, 2.15] p<0.001), private insurance (OR, 1.32 [95% CI: 1.09, 1.62] p<0.006), and ‘No charges’ (OR, 2.83 [95% CI: 1.10, 7.28] p<0.030) had higher mortality. Compared with rural, urban non-teaching (OR, 4.54 [95% CI: 2.97, 6.93] p<0.001) and urban teaching (OR, 4.06 [95% CI: 2.68, 6.17] p<0.0001) had higher all-cause mortality. Compared with small bed hospitals, large bed hospitals had lower mortality (OR, 0.69 [95% CI: 0.59–0.83] p<0.001). Mortality according to regional variations was not statistically significant (Table 6).
Figure 1: All-cause in-hospital mortality by sex and race in hospitalizations with PAH: 2007 versus 2017
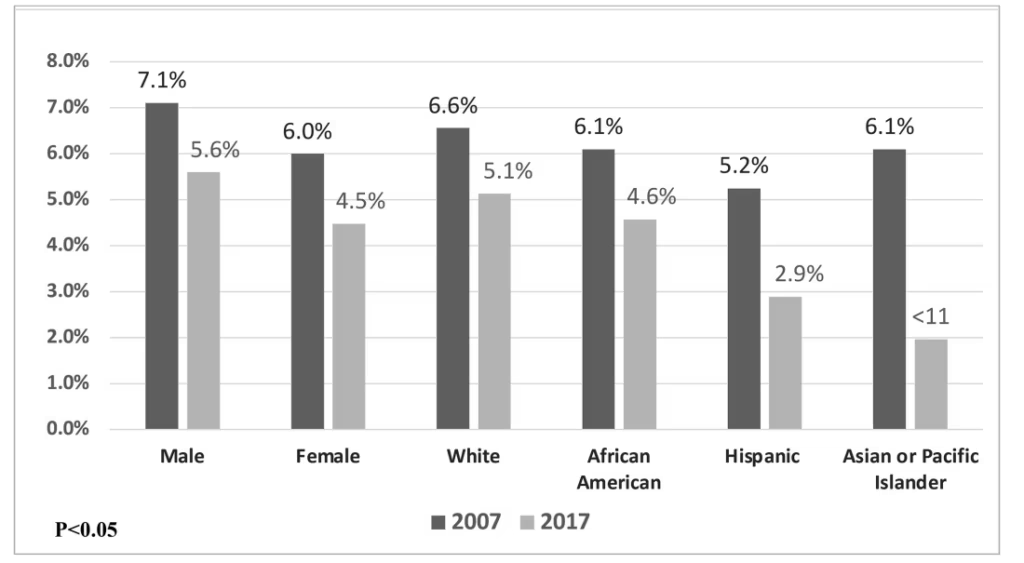
Cell sizes n<11 were not reported as per HCUP’s privacy guidelines, e.g. mortality data for Asian or Pacific Islander in 2017.
HCUP = Healthcare Cost and Utilization Project; PAH = pulmonary arterial hypertension.
Table 6: Independent predictors of all-cause mortality in hospitalizations with IPAH
| Predictors | Adjusted OR | 95% CI | p | |
| LL | UL | |||
| Age (years) at admission |
|
|
| <0.001 |
| 18–44 years | Referent |
| ||
| 45–64 years | 2.09 | 1.55 | 2.82 | <0.001 |
| ≥65 years | 4.09 | 2.97 | 5.63 | <0.001 |
| Male versus female | 1.18 | 1.03 | 1.35 | 0.015 |
| Race |
|
|
| 0.018 |
| White | Referent |
| ||
| African American | 0.79 | 0.66 | 0.95 | 0.014 |
| Hispanic | 0.65 | 0.48 | 0.86 | 0.003 |
| Asian or Pacific Islander | 0.77 | 0.51 | 1.17 | 0.220 |
| Native American | 0.83 | 0.46 | 1.48 | 0.522 |
| Others | 0.86 | 0.58 | 1.27 | 0.435 |
| Non-elective versus elective admission | 1.36 | 1.10 | 1.67 | 0.004 |
| Primary expected payer |
|
|
| <0.001 |
| Medicare | Referent |
| ||
| Medicaid | 1.66 | 1.29 | 2.15 | <0.001 |
| Private including health maintenance organization | 1.32 | 1.09 | 1.62 | 0.006 |
| Self-pay | 0.80 | 0.45 | 1.40 | 0.434 |
| No charges | 2.83 | 1.10 | 7.28 | 0.030 |
| Others | 0.69 | 0.37 | 1.29 | 0.244 |
| Median household income national quartile for patient ZIP Code |
|
|
| <0.001 |
| 0–25th | Referent |
| ||
| 26–50th | 0.96 | 0.80 | 1.16 | 0.704 |
| 51–75th | 0.68 | 0.57 | 0.82 | <0.001 |
| 76–100th | 0.76 | 0.63 | 0.91 | 0.003 |
| Bed size of hospital |
|
|
|
|
| Small | Referent | <0.001 | ||
| Medium | 0.83 | 0.68 | 1.02 | 0.079 |
| Large | 0.69 | 0.59 | 0.83 | <0.001 |
| Location/teaching status of hospital |
|
|
| <0.001 |
| Rural | Referent |
| ||
| Urban non-teaching | 4.54 | 2.97 | 6.93 | <0.001 |
| Urban teaching | 4.06 | 2.68 | 6.17 | <0.001 |
| Region of hospital |
|
|
| 0.818 |
| North-east | Referent |
| ||
| Mid-west | 0.95 | 0.78 | 1.16 | 0.591 |
| South | 1.04 | 0.88 | 1.23 | 0.614 |
| West | 1.01 | 0.83 | 1.22 | 0.931 |
| Clinical Characteristics |
|
|
|
|
| Acquired immune deficiency syndrome | 1.41 | 0.52 | 3.82 | 0.495 |
| Alcohol abuse | 1.02 | 0.64 | 1.63 | 0.920 |
| Deficiency anaemias | 0.78 | 0.66 | 0.92 | 0.003 |
| Rheumatoid arthritis/collagen vascular diseases | 1.03 | 0.77 | 1.38 | 0.818 |
| Chronic blood loss anaemia | 1.38 | 0.93 | 2.05 | 0.109 |
| Congestive heart failure | 1.77 | 1.55 | 2.02 | <0.001 |
| Chronic pulmonary disease | 1.26 | 1.11 | 1.44 | 0.001 |
| Coagulopathy | 1.96 | 1.63 | 2.35 | <0.001 |
| Depression | 0.60 | 0.46 | 0.79 | <0.001 |
| Hyperlipidaemia | 0.54 | 0.45 | 0.63 | <0.001 |
| Smoking | 0.49 | 0.41 | 0.60 | <0.001 |
| Diabetes, uncomplicated | 0.89 | 0.74 | 1.06 | 0.184 |
| Diabetes with chronic complications | 0.72 | 0.58 | 0.90 | 0.004 |
| Drug abuse | 1.07 | 0.64 | 1.80 | 0.792 |
| Hypertension | 0.86 | 0.75 | 0.99 | 0.036 |
| Hypothyroidism | 0.84 | 0.69 | 1.02 | 0.085 |
| Liver disease | 1.20 | 0.92 | 1.58 | 0.179 |
| Lymphoma | 0.71 | 0.41 | 1.25 | 0.234 |
| Fluid and electrolyte disorders | 1.68 | 1.48 | 1.91 | <0.001 |
| Metastatic cancer | 1.52 | 1.04 | 2.22 | 0.032 |
| Other neurological disorders | 0.98 | 0.76 | 1.25 | 0.859 |
| Obesity | 0.87 | 0.70 | 1.08 | 0.203 |
| Peripheral vascular disorders | 1.58 | 1.27 | 1.97 | <0.001 |
| Renal failure | 1.38 | 1.19 | 1.60 | <0.001 |
| Solid tumour without metastasis | 1.65 | 1.12 | 2.42 | 0.011 |
| Valvular heart disease | 1.13 | 0.96 | 1.33 | 0.145 |
| Complications |
|
|
|
|
| Cor pulmonale | 1.21 | 0.85 | 1.72 | 0.296 |
| Pulmonary embolism | 2.03 | 1.52 | 2.71 | <0.001 |
| Pulmonary haemorrhage and haemoptysis | 3.50 | 2.41 | 5.09 | <0.001 |
| Atrial fibrillation/flutter | 1.07 | 0.94 | 1.22 | 0.304 |
| Ventricular fibrillation/flutter | 1.63 | 0.67 | 3.96 | 0.278 |
| Supraventricular tachycardia | 1.22 | 0.80 | 1.86 | 0.346 |
| Cardiac arrest | 27.22 | 19.70 | 37.60 | <0.001 |
| Cardiogenic shock | 6.13 | 4.58 | 8.20 | <0.001 |
p<0.05 indicates statistical significance; multivariable analysis was adjusted for baseline demographics, pre-existing comorbidities and in-hospital complications.
CI = confidence interval;IPAH = idiopathic pulmonary arterial hypertension;LL = lower level;OR = odds ratio;UL = upper level;ZIP = Zone Improvement Plan.
Discussion
This is the first large, retrospective cohort study of patients with the diagnosis of IPAH that compares the outcomes of admissions for IPAH over a 10-year span assessing 2007 and 2017 using the HCUP NIS database.
Our results show that hospitalizations for IPAH declined by approximately 40% from 2007 to 2017. The median age for hospitalizations also significantly decreased with the median age for hospitalization of 72 years in 2007 and 66 years in 2017. Hospitalizations for patients >65 dropped from 64.4% in 2007 to 56.6% in 2017. Hospitalizations for the age group 45–64 years increased from 25.4% to 31.2% of total IPAH hospitalizations. The reduction in the number of hospitalizations and the younger age of admissions may be attributed to a variety of factors, including progress in diagnoses and management. Significant advances in medical treatment and the availability of new medications have occurred over the last two decades. There are many Food and Drug Administration (FDA)-approved medications for IPAH. These medications primarily work by targeting nitric oxide, endothelin, PPAs and activin signalling pathway, which has recently been identified. Until 2007, there were around six approved medications, which included intravenous epoprostenol (1995), bosentan (2001), subcutaneous treprostinil (2002), inhaled iloprost (2004), intravenous treprostinil (2005) and sildenafil (2005). Since 2007, around 10 medications have been approved for PAH treatment and include ambrisentan (2007), tadalafil (2009), inhaled treprostinil (2009), intravenous epoprostenol (2010), oral treprostinil (2013), riociguat (2013), macitentan (2013), selexipag (2015), treprostinil inhalation powder for PAH (2022), sotatercept (2024) and treprostinil inhalation powder approved for both PAH and PH-interstitial lung disease.15,16 SERAPHIN trial (Study of Macitentan on Morbidity and Mortality in Patients With Symptomatic Pulmonary Arterial Hypertension; ClinicalTrials.gov identifier: NCT00660179) showed that 10 mg of macitentan decreased the risk and rate of all-cause hospitalization as compared with placebo.17 GRIPHON trial (Selexipag for the treatment of pulmonary arterial hypertension; ClinicalTrials.gov identifier: NCT01106014) used selexipag for the treatment of IPAH and showed that compared with placebo, patients on selexipag had significantly lower hospitalizations.18 In 2024, sotatercept was approved as the first activin signalling inhibitor, which significantly improved exercise capacity and reduced the risk of death, lung transplantation or hospitalization lasting more than 24 h for worsening PAH.3,19 That same year, the combination of macitentan/tadalafil was evaluated in the phase III A DUE trial (Clinical Study to Compare the Efficacy and Safety of Macitentan and Tadalafil Monotherapies With the Corresponding Fixed-dose Combination Therapy in Subjects With Pulmonary Arterial Hypertension; ClinicalTrials.gov identifier: NCT03904693), which demonstrated that the fixed-dose combination significantly reduced PVR compared with either macitentan or tadalafil alone in patients with PAH. The trial included treatment-naïve or monotherapy-stable patients and showed a 28–29% greater reduction in PVR with the combination therapy.20 Additional supporting evidence includes the OPTIMA study (2020; Clinical Study Evaluating the Effects of First-line Oral cOmbination theraPy of maciTentan and tadalafIl in Patients With Newly Diagnosed pulMonary Arterial Hypertension; ClinicalTrials.gov identifier: NCT02968901), which assessed initial dual therapy with macitentan and tadalafil in patients with newly diagnosed PAH.21,22 With the approval of these newer medications since 2017, we anticipate a continued and potentially significant reduction in hospitalizations for patients with PAH. These findings highlight significant progress in the management of PAH over the past decade. The decline in hospitalizations seen in our study, along with a shift towards younger hospitalized patients, suggests earlier diagnosis and more effective outpatient management. The introduction and increasing use of targeted therapies, after 2007, have likely contributed to improved clinical stability and reduced the need for hospitalization. Collectively, these trends point towards a positive impact of therapeutic advancements on PAH patient outcomes. In addition to pharmacological advancements, increased disease awareness and improved outpatient care infrastructure have played a crucial role in reducing hospitalizations.17 In 2014, the Pulmonary Hypertension Association established Pulmonary Hypertension Care Centers across the USA, providing resource standards for certification.23 The overall reduction in hospitalizations seen in this study is consistent with earlier findings by Anand et al., who reported a 58% decrease in PAH-related hospitalizations from 2001 to 2012, underscoring a sustained decade-long trend of improvement.24
In our study, the total all-cause mortality significantly decreased from 6.4% in 2007 to 4.8% in 2017. Data from the REVEAL registry in 2012 also showed improvement in survival in patients who were enrolled from 2006 to 2009.9 Since 2007, there have been additional FDA-approved drugs available and increased use of combination therapy, which has been shown to improve outcomes and decrease hospitalizations, as seen in the AMBITION trial (A Study of First-Line Ambrisentan and Tadalafil Combination Therapy in Subjects With Pulmonary Arterial Hypertension; ClinicalTrials.gov identifier: NCT01178073).25 From the currently available medications to date, IV epoprostenol was the only therapy that showed mortality benefit in a short–term study, but registries have shown increased longevity as compared with historical data over the last 20 years.26 However, now sotatercept has also shown mortality benefits. The ZENITH trial (A Study of Sotatercept in Participants With PAH WHO FC III or FC IV at High Risk of Mortality; ClinicalTrials.gov identifier: NCT04896008) showed a 76% reduction in the relative risk of a composite endpoint of all-cause death, lung transplantation or hospitalization for worsening PAH, compared with placebo. The benefit was seen in the high-risk patients who were already receiving and tolerating maximum therapy.19 It is likely due to the use of these medications that has improved all-cause mortality over the years.
Even though women had a higher number of hospitalizations compared with men in 2007 (65.2% versus 34.8%) and 2017 (68.4% versus 31.6%), the mortality was higher in men in 2007 (7.1% versus 6.0%) and 2017 (5.6% versus 4.5%). The multivariable analysis for mortality also shows that compared with females, males have higher mortality (OR, 1.18 (95% CI: 1.03, 1.35) p=0.015). There are many theories for higher mortality in men, and it is thought to be due to a phenomenon known as the ‘sex paradox’. A study by DesJardin et al. investigated the sex paradox using the results from the Pulmonary Hypertension Association Registry (PHAR).27 Various explanations for this disparity have been proposed, including worse baseline haemodynamics in men, reduced pulmonary vascular remodelling, greater immune dysregulation, less aggressive treatment and different therapeutic responses. The predominant hypothesis centres on sex-based differences in right ventricular (RV) function, as males generally have lower RV ejection fractions and poorer RV adaptation to the increased afterload of PAH – factors strongly linked to survival. This supports an ‘opposite-effects’ model, in which female sex switches from being a risk factor for developing PAH to offering a survival advantage once the disease is present. However, alternative explanations must be considered, particularly collider-stratification bias, which can make a risk factor (like female sex) appear protective due to statistical distortions from stratifying by disease status. In the analysis of the PHAR registry, women presented with more severe baseline disease but still had better survival, and the differences could not be explained by available clinical variables. The data suggest that unmeasured, higher risk pathways – more common in men, such as methamphetamine use or HIV – may lead to PAH and independently increase mortality, creating the illusion of female sex being protective. Modelling confirmed that collider-stratification bias could plausibly account for these mortality differences. Limitations in PHAR, such as lack of imaging data, detailed comorbidity information and nuanced PAH aetiology classification, restrict deeper investigation.27 Ultimately, sex-based mortality differences in PAH are likely due to a combination of biological, treatment and unmeasured risk pathways.
Whites had higher mortality than other races in 2007 (6.6%) and 2017 (5.1%). They also had the highest number of hospitalizations at both time points with 67.4% in 2007 and 64.1% in 2017. In the multivariable analysis for predictors of mortality, Black and Hispanic patients were less likely to die than White patients. In contrast, several previously reported studies and registries in PAH showed higher mortality in Black and Hispanic patients compared with White patients.28–30 However, the 5-year outcome study of the REVEAL registry also showed that White patients had higher mortality compared with Black and Hispanic patients.13 The possible reasons for racial variations may be related to genetic, structural, pharmacogenetic and socioeconomic differences.31 Additionally, there may be racial variation in risk for subgroups of IPAH, which may play a role in mortality rates.31
Regional variations showed decreased hospitalizations in the north-east but increased hospitalizations in the south and west from 2007 to 2017. The reason for this remaims unclear; however, it could be related to variations in access to expert care, as there is a larger number of PAH specialty centres in the north-east.
Our study showed that compared with rural, urban-teaching and non-teaching hospitals had higher all-cause mortality. Studies from other diseases have shown the opposite, with rural communities associated with higher age-adjusted mortality rates and a greater number of potentially preventable deaths from the five leading causes of death compared with urban areas. This is due to a combination of social, geographic, behavioural and structural factors.32 Our hypothesis is that higher mortality rates among patients with PAH in urban hospitals likely reflect referral and selection bias rather than differences in quality of care. Urban centres, particularly teaching hospitals, often receive the most critically ill or complex cases transferred from rural areas, which increases their observed mortality. These patients may already have advanced disease or complications by the time they arrive, skewing outcomes. Additionally, urban hospitals may have more comprehensive coding and documentation practices, capturing more comorbidities and deaths. In contrast, rural hospitals may treat more stable patients or have underreported outcomes. The higher mortality seen in urban settings is likely due to the severity of illness at presentation rather than inferior care.
Previous studies have shown that patients with PAH carry significant economic burden. According to the findings of an analysis using the Optum Research Database from 2007 to 2011, the average cost of all-cause hospitalizations among patients with PAH (n=5,582) was $34,123 ± $107,005 (mean + standard deviation) per hospitalization.33 Our data show that the total charges for IPAH in United States Dollars (USD), calculated as median, interquartile range, significantly increased from 2007 to 2017 ($26,016 to $46,450) and are not explained by inflation alone. However, when comparing IPAH hospitalization charges with overall hospitalization charges, IPAH hospitalization charges have decreased from 0.09% ($340,839,104/$359,759,284,438) to 0.06% ($266,170,409/$434,241,375,872) from 2007 to 2017 (Table 5).
There are a few limitations in this study. Using the ICD-9-CM and ICD-10-CM codes, we included individuals who were hospitalized with IPAH. First, we cannot say whether individuals received a complete IPAH evaluation and were diagnosed with a right heart catheterization. Second, based on the NIS database, we are unable to determine if the patients have had IPAH therapy. Third, the IPAH diagnosis could be inaccurate, patients may have been diagnosed with PH due to secondary causes, and an ICD code for IPAH was used. Fourth, the number of hospitalizations may not be precise since a patient’s readmission was counted as a new hospitalization. Finally, there may be coding mistakes in the NIS database, and the primary discharge diagnosis may not adequately reflect the disease that resulted in admission to the hospital.
Since the first therapeutic intervention for PAH in 1995, significant advances have been made in the management of IPAH. Despite these therapeutic and clinical advancements, which have resulted in improved survival rates, IPAH remains a disease with substantial morbidity and mortality. The importance of early detection and diagnosis is crucial. Studying patterns in patient characteristics related to hospitalizations can aid in the development of future research and treatment approaches. This is the first study that has used the nationwide data to present the analysis of hospitalizations related to IPAH. According to our data, total hospitalizations and all-cause mortality have decreased between 2007 and 2017. Hospitalizations are higher in females, but mortality is higher in males and White race. Hospitalizations have decreased in the north-east but increased in the US south and west. Even though the number of IPAH hospitalizations and all-cause mortality has decreased, the total cost of IPAH hospitalizations has risen but to a lesser degree than all–cause hospitalizations. These trends can be accounted for by the impact of increased availability of PAH therapy in the modern treatment era; however, IPAH remains an incurable and progressive disease with substantial healthcare costs. Longitudinal population studies are likely to provide more information pertaining to identifying cost-effective management strategies to reduce the healthcare burden.


